While working on the NES version of MDFourier we noticed that sometimes some of the channels being compared would change in amplitude between takes of the same console. The difference seems to be between -3dBFS and 3dBFS, which is big enough to be considerable.
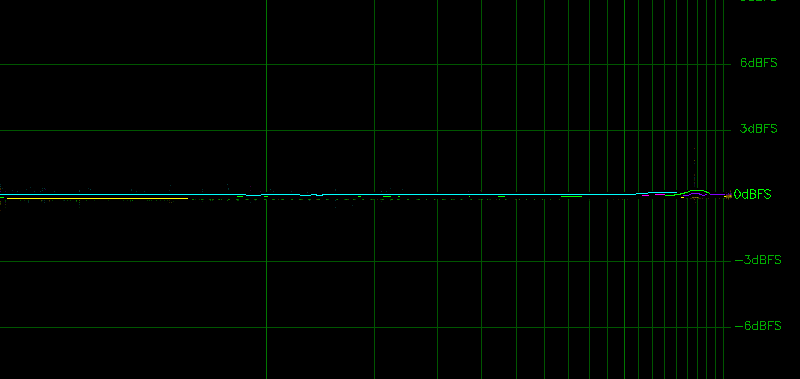
Many details will be overlooked, but for simplicity a good match between the compared files would imply all lines being flat following the 0dBFS line. This is because the vertical axis represents the difference in amplitude between the files.
Here is a zoomed in example, presenting two recordings that match very closely:
The horizontal axis is the range of frequencies that is being compared, we typically go with 20Hz-20kHz range, since this covers the human hearing spectrum.
All channels being compared have a specific color, as described in the following image:
Here is an example of two recordings from the same console made consecutively, that show differences in amplitudes:
As you can see, there is a difference in the DMC pitches and Noise channels, which is flat through the whole frequency range at about -2dBFS.
These differences fluctuate between various values, while the other channels remain constant during consecutive recordings.
It was suggested that this could be caused by the triangle channel having slightly different phase each time the test tone was played. This correlation was confirmed by comparing the Phase and Waveform graphs from MDFourier as shown below.
Here are the wave forms of the first triangle pulses from matching recordings:
In these graphs, the vertical axis is the amplitude and the horizontal axis is time, measured in frames indicated by vertical lines. As you can see, both signals start at the same point in time. This is what we call being in phase with each other. Deviations in position are measured in degrees, following what is used in trigonometric functions.
Here are the same segments taken from consecutive recordings, when the DMC pitches and Noise channels vary in amplitude.
As you can see, the second triangle wave form is almost half a frame displaced horizontally to the left. This is an out of phase scenario, and causes the amplitude discrepancy in the two other channels.
Here is a Phase Difference plot from two matching recordings. The horizontal axis is frequency, and the vertical axis is the phase difference in degrees.
These graphs have consistently shown that phases tend to diverge with frequency when compared this way1, but the part that has proven useful so far is the left part of the image. As you can see all signals start at 0 degree phase difference.
For contrast, here is the Phase differences graph of the same console against itself during consecutive recordings:
You can see that although some triangle patterns start at 0 degrees, most of them are out of phase by 90 degree multiples. These are the results of comparing the phase from the waveforms in figures 6 and 7.
As to the amplitude effect over DMC pitches and Noise channels, the wave forms of each are presented for completeness.
It was noted that recording after power cycling the NES console–cold booting it–would always produce the same phase, and thus create recordings without variation. This is a very important aspect of the project, since it gives repeatability and consistent results.
Due to the impact this issue presents, we are figuring out the measures to be taken. I personaly believe that due to the severity of the differences we should enforce mdfourier to run only when cold boot is guaranteed.